- Introduction
- Technical information
- Getting Started
- Description of functionality
- Screen Guides
- Cashflow Guides
- Budgeting and Forecasting
- Company Group Consolidation
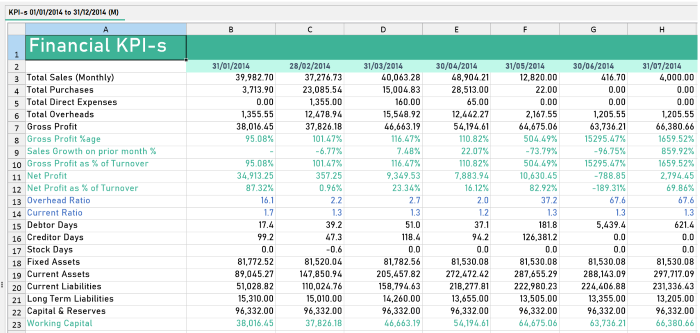
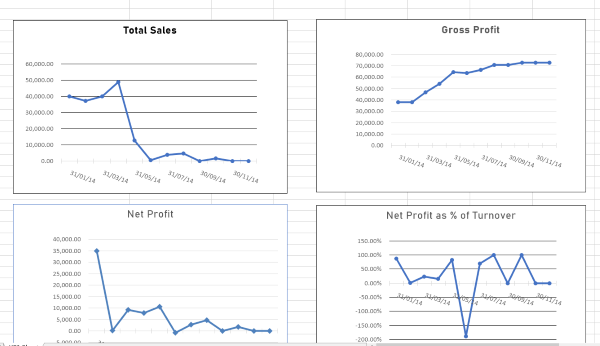
The Key Performance Indicators
The Key Performance Indicators section displays 21 KPIs and their graphic representation.
- Total Sales (Monthly)
- Total Purchases
- Total Direct Expenses
- Total Overheads
- Gross Profit
- Gross Profit %age
- Sales Growth on prior month %
- Gross Profit as % of Turnover
- Net Profit
- Net Profit as % of Turnover
- Overhead Ratio
- Current Ratio
- Debtor Days
- Creditor Days
- Stock Days
- Fixed Assets
- Current Assets
- Current Liabilities
- Long Term Liabilities
- Capital & Reserves
- Working Capital
KPI can be produced across the same interval range as the other reports.
Debtor/Creditor Days Calculation
The system calculates debtor and creditor days using a 12-month period and applies the following formula:
(Invoices minus Payments 12months ago) + (Invoices minus Payments Current)/2
Divided by: Total Sales
Multiplied by: *365
Stock Days
The system applies the following formula:
(Stock at the end of the previous period) + (Stock at the end of the current period ) /2
Divided by: Total Purchases for the period
Multiplied by: Number of Days in the reporting interval (e.g. 28 for February)