KPI Reporting for Sage 50 Users
Measure the performance that matters
KPI Reporting is an integral part of the ProudNumbers Management Accounts platform. It brings together key measures of profitability, liquidity and working capital, helping accountants and finance teams monitor business performance and identify important changes and trends.
Key financial and performance indicators
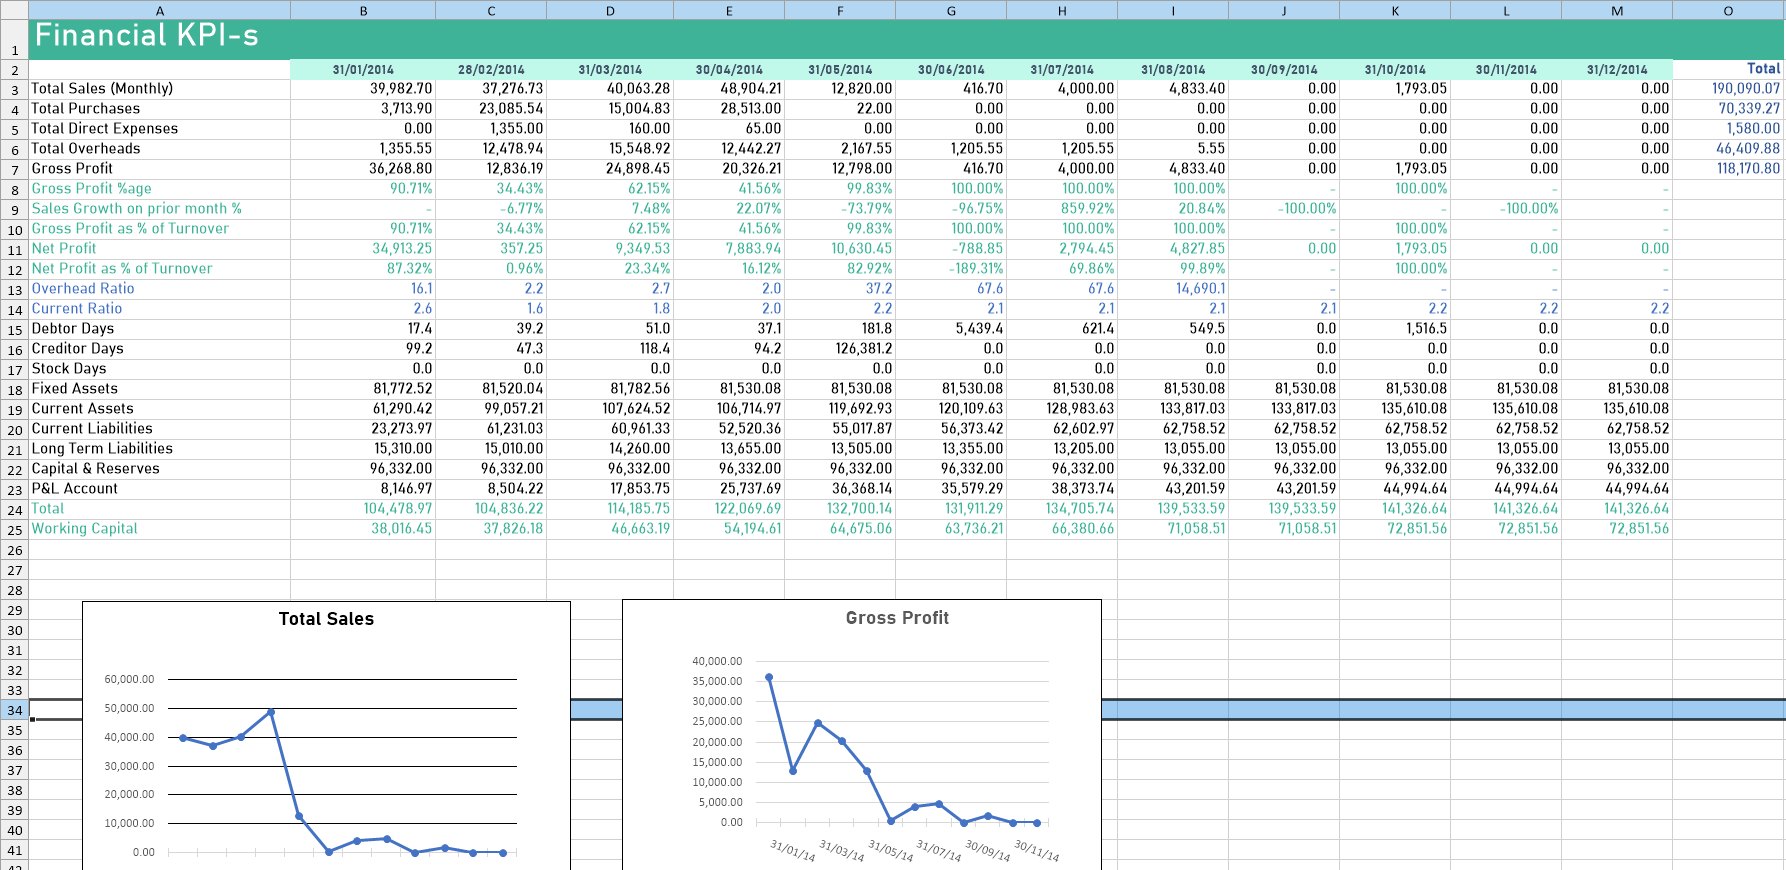
ProudNumbers calculates a range of KPIs from your financial data, providing additional insight alongside your Management Accounts.
These include:
- Total Sales
- Sales Growth
- Gross Profit
- Gross Profit as % of Turnover
- Net Profit
- Net Profit as % of Turnover
- Current Ratio
- Quick Ratio
- Working Capital
- Debtor Days
- Creditor Days
- Stock Days
Rather than calculating and maintaining these measures separately, ProudNumbers makes them readily available as part of your management reporting.
- Sales & Profitability KPIs
- Liquidity & Working Capital
- Debtor, Creditor & Stock Days
- Flexible Reporting Periods
- Graphical Analysis
- Direct Export to Excel
Understand profitability and performance
Monitor Sales and Sales Growth alongside Gross and Net Profit to understand how business performance is changing.
Profitability ratios, including Gross Profit and Net Profit as a percentage of Turnover, provide additional context and help identify changes that may not be immediately apparent from the headline figures alone.
Monitor liquidity and working capital
ProudNumbers brings together important measures of short-term financial health, including Current Ratio, Quick Ratio and Working Capital.
Debtor Days, Creditor Days and Stock Days provide further insight into how effectively working capital is being managed, helping to highlight areas that may require attention.
Flexible reporting periods
KPIs can be calculated and analysed over different reporting periods, allowing you to measure performance over the timeframe most relevant to your organisation.
This flexibility makes it easier to examine short-term changes as well as longer-term performance and trends.
Visualise performance and trends
ProudNumbers presents KPIs both as figures and graphs, making changes in performance easier to see and understand.
Graphical analysis provides a clear view of trends in areas such as sales, profitability, liquidity and working capital, helping management quickly identify significant movements and areas worth investigating further.
Export and share
KPI information can be exported directly to Excel for further analysis or sharing.
For a more detailed explanation of individual KPIs, how they are calculated and what they can tell you about business performance, read our article on Key Performance Indicators.
Part of the ProudNumbers Management Accounts platform
KPI Reporting is one of the integrated analysis tools included within ProudNumbers.
Together with Management Accounts, Budgeting & Forecasting, Cash Flow Analysis and Debtors & Creditors, it helps finance teams move beyond producing financial reports to understanding the performance behind the numbers.
See how professional management accounts can be produced in less than five minutes.