Screen layout
It is quick to familiarise yourself with the screen layout.
The screen has 3 main active areas:
Top menu bar
Access point to open Clients files (File/Open/Delete etc.)
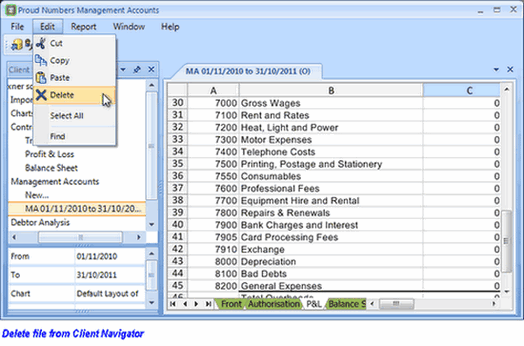
Other features for basic operation.
The Report menu is used to generate Management Accounts, Debtor Analysis and KPI's.
2. Client Folder
The Client Folder displays the selected clients data. Only one client is displayed at a time.
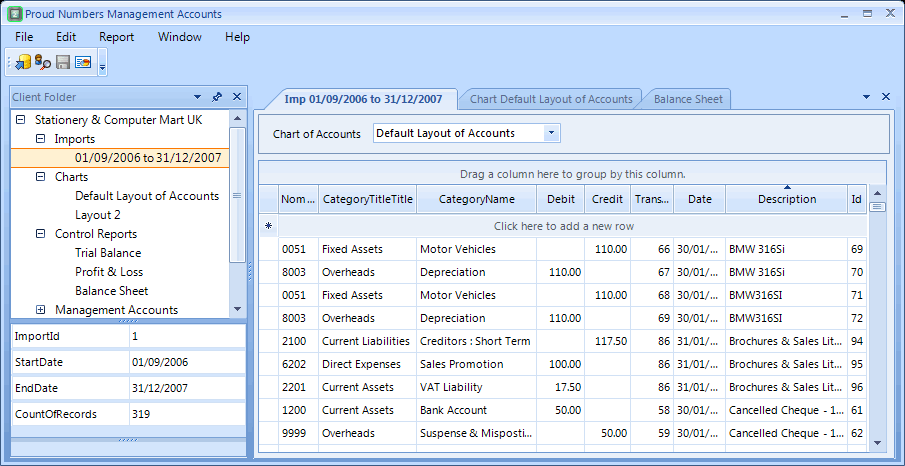
Upper : Tree gives access to customers data and report generation:
Lower : Statistics for report displayed on RHS including :
Click a tree item to generate or select a report.
3. Desk
The desk is the data viewing area.
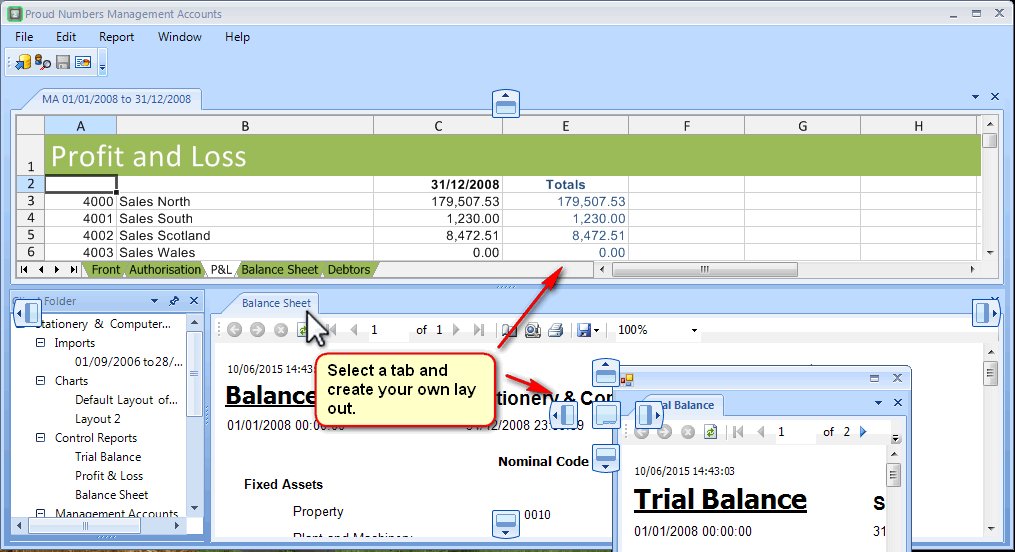
Control reports are non editable but have a mini-bar for viewing & printing.
Management Accounts have some spreadsheet functionality and multiple contents named in the lower tab bar.
These can be spread over the screen to make the display that best suits you.
Layout
Just pick up the 'sheet' on the desk and place it on a locating arrow.
Report sheet Functions
See Section 180 for detail, but as a quick idea:
Sort column by clicking on the column header.
Left click and drag : a column to the area above the title bar to group whole by the selected column. Return by reverse procedure.
Move a column title to re arrange column order.
Right click for editing options : row or column or cell layout is flexible, see below.